


Contents
- Method of calculation
- Parameters Forex Bollinger Bands
- Bollinger Bands in Forex trading
- How to use Bollinger Bands to trade Forex
- Several practical notes
The technical idea was proposed in 1987 by Perry Kaufman in the book «The New Commodity Trading Systems and Methods», and familiar to all modern form and name «Bollinger Bands» indicator was received from american analyst John Bollinger. The methodology first proved its worth in futures markets, and later it proved to be stably effective also on more speculative currency assets.
Method of calculation
Bollinger Bands assesses how the current price is relative to the normal trading range, that is − how far it can go before reversal to main trend. The task of indicator is to show all the price movement in dynamic corridor, boundaries of which will be sufficiently substantiated for statistical purposes. In addition, movement within the channel must be confirmed by trading volumes.
Statistics show that 75% of the trading time the price spends within two and 85-90% of the time − in the range of three standard deviations. It is assumed that if price has exceeded the upper limit − trading asset is too overbought, if price has fallen for lower limit − unreasonably oversold. Further, according to hypothesis of market efficiency, participants should react and return price to its «fair value», that is, to zone of central trend line. Bollinger Bands indicator MQ4 uses concept of standard deviation to estimate volatility, that is, the calculation mechanism independently adjusts width of channel.
Bollinger Bands Forex builds on price chart three dynamic lines. The center line is a moving average (of any type), and the upper/ lines are offset relative to it by a distance of several standard deviations for he calculation period:
- UpperBand=MovingAverage+(K*StandardDeviation)
- LowerBand=MovingAverage-(K*StandardDeviation)
Adjustment of parameters should provide 90-95% of price movement within the channel and only 5-10% − beyond its limits.
Parameters forex Bollinger Bands
Standard version of indicator is included in the package of all popular trading platforms; basic parameters are the same, differences can only concern the visual display. For Bollinger Bands indicator mt4, by default, center line is SMA (20), but moving average type and price type can be changed. Lower limit: the baseline value SMA(20) − 2 standard deviations; upper − SMA (20) + 2 standard deviations.
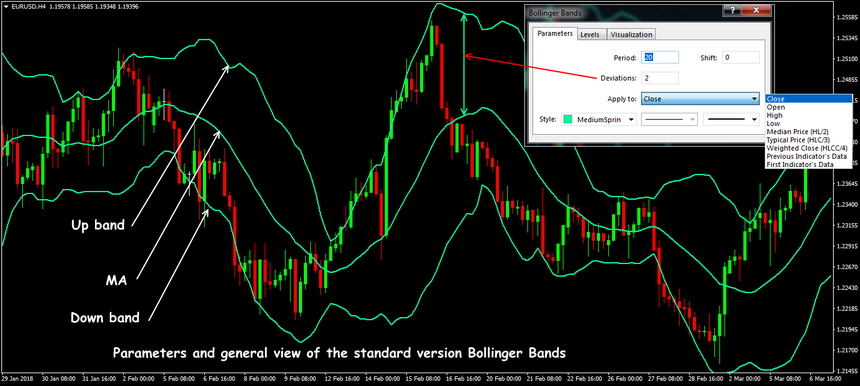
Typically, «period» option Bollinger Bands indicator Forex is selected in range from 13 to 30; most popular value of 20 stably works on all foreign exchange assets. There are examples of successful use of Fibonacci base numbers, for long-term trading you can apply round values (50, 100, 150, 200), as well as the number of days in trading and calendar year (240, 365).
A «longer» parameter reduces sensitivity of indicator, which is especially harmful for assets with low volatility. Reducing the period of calculation leads to the fact that the boundaries become «torn», the price too often crosses them and there is a lot of false signals.
For the correct choice of period, you can observe how the price behaves when pattern is formed in zone of line of boundaries of pattern «Double Bottom» (for the bottom) or «Double Top» (for the top): second key point (Bottom or Top) must remain within Bollinger Bands. If this point is outside the boundaries of channel, then period is too short.
Recommended periods of the basic moving average for timeframes: from M1 to M15 − 10; from M15 to H1 − 20; from H1 to D1 − 50; more than 1 day − 60.
The width of Forex Bollinger Bands is directly related to current volatility:
- if channel expands − volatility increases − current trend is strengthened;
- if boundaries of bands begin to converge − volatility falls − current trend is weakening.
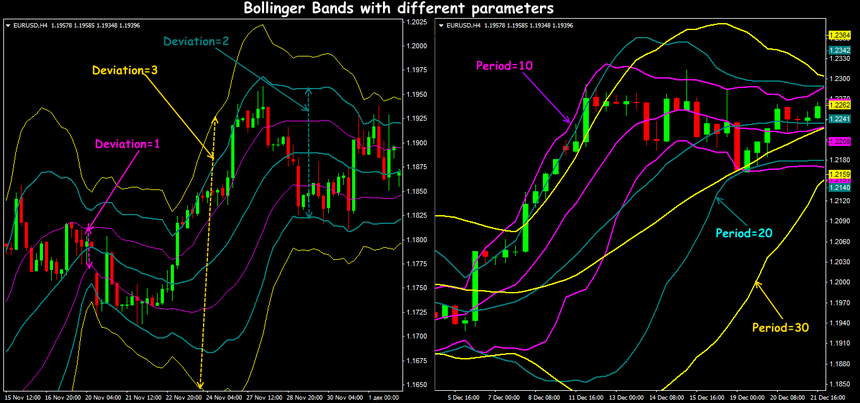
Value of standard deviation shows how far current price «left» from average value (calculated automatically). Parameter «shift» can also be selected taking into account volatility of asset − it corrects current lag.
For Forex-assets usually use the closing price, although author used a weighted average price (but in fact he worked on promotions!); for high-volatility assets it makes sense to apply an average and typical price.
Bollinger Bands in Forex trading
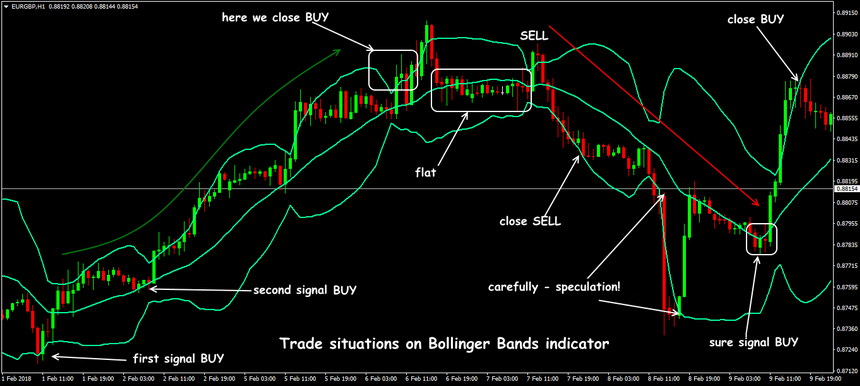
The main trading idea of mt4 bollinger bands indicators is based on the assumption that the middle line exactly follows the trend.
- during periods of flat boundaries of Forex Bollinger Bands indicator are almost parallel and price moves within channel;
- during periods of a strong trend, angle of inclination indicates strength and direction of movement.
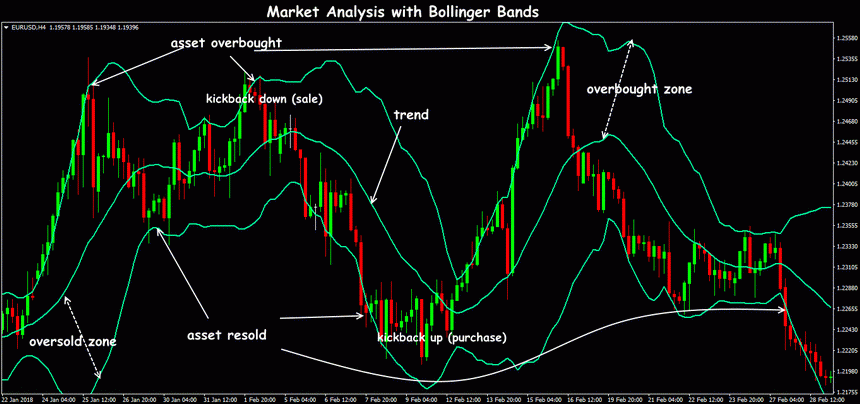
It is understood that if price moves above center line of channel (in the purchase area), then trend is upward, if lower (in the sales zone) − bearish. Dynamic lines of bands are considered boundaries of overbought/oversold zones.
With Forex trading with Bollinger Bands, two main trading tactics are used:
- rollback from top/bottom line counting on the movement to opposite border of channel or, at least, to midline;
- breakdown of channel boundary and further − on trend: above upper limit − BUY, below lower limit − SELL.
The upper and lower boundaries are strong dynamic support/resistance levels, so Bollinger Bands in Forex trading in countertrend strategies are considered less risky.
How to use Bollinger Bands to trade Forex
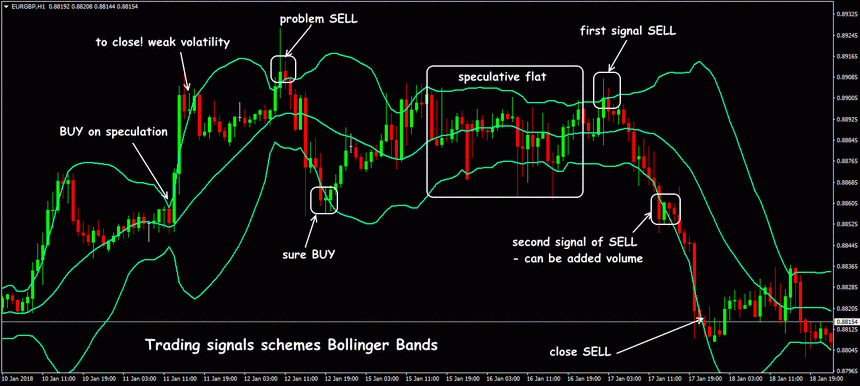
The most recognized and common methods of using Bollinger Bands to trade Forex are the following trading tactics:
- Breakdown of Bollinger Bands border
If market flat, and long enough, it is worth to prepare for start of a new or continuation of a strong trend. The deal opens in direction of strongest trend after confident closing of 1-2 candles beyond the borders of strip.
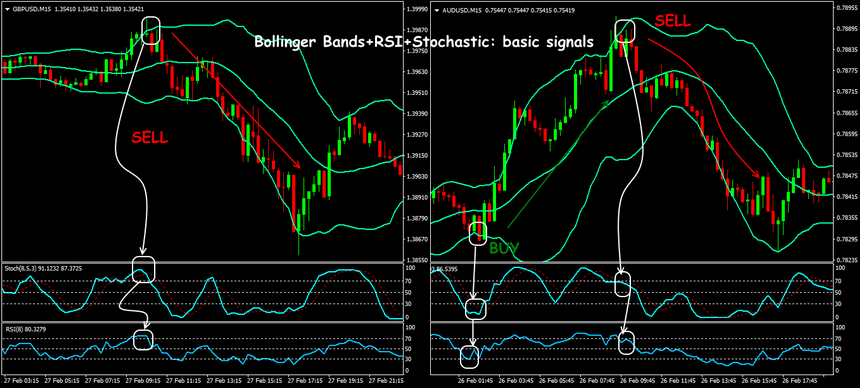
In addition to rebound from central line, you can use a sufficiently sensitive oscillator to confirm end of the rollback, for example, Stochastic, RSI or WPR.
- Continuation and reversal of trend
Popular tactics give good results in a stable market, but during speculation it has some peculiarities. Bollinger Bands trading against entry of large volumes has a high degree of risk.
Before the turn comes, the market can «show» a short series of very volatile fluctuations and knock out your StopLoss. If price approaches border of Bollinger Bands channel, but angle of inclination of line decreases, then, most likely, price breaks and only then it unfolds. If channel opens, this will be a signal for upcoming breakthrough of border and continuation of movement.
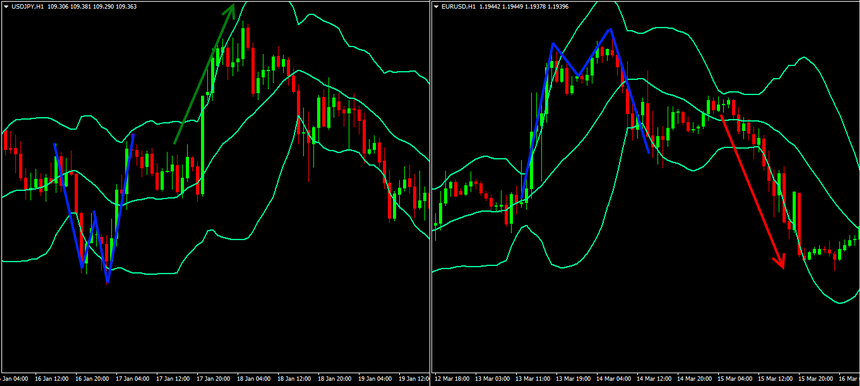
- Graphic patterns complete with Bollinger Bands
It is supposed to trading Bollinger Bands Forex with purpose of working out graphic patterns of turn emerging directly in border zone. Process of identifying such figures is simplified by analyzing appearance of key points relative to lines and ignoring facts of absolute price values.
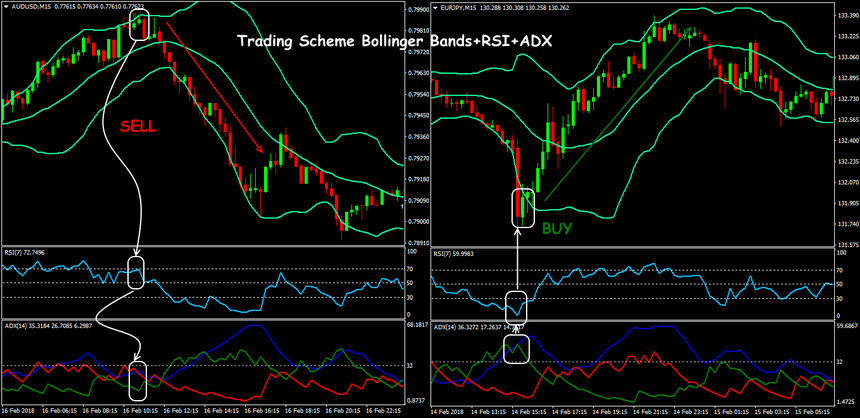
Enthusiasts trading Forex with Bollinger Bands use indicator technique as a filter for the values of oscillator:
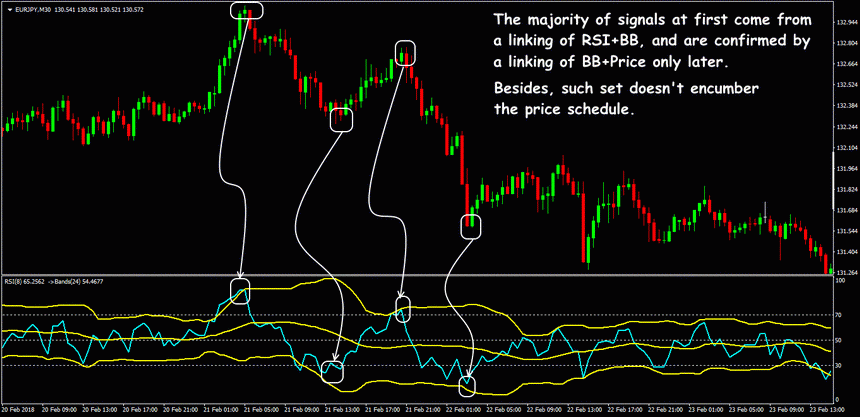
Several practical notes
Algorithms efficiency of Bollinger Bands indicator depends on speculative nature of market and the stable volatility of trading asset; strong price shots easily «break» mathematics of calculation, and on incorrect signals in low liquid markets, author of indicator himself complained in his book «Bollinger on Bollinger Bands».
Disadvantages can be considered traditional lag and subjectivity of price behavior near borders of Bollinger Bands channel, however this is compensated by most important advantages of indicator: the accuracy of trend identification and assessment of market activity.